


Turn operational data intobetter business decisions.
Connect fragmented information, build trusted reporting, and give leaders the visibility to act with confidence.
We help organisations consolidate operational data, define meaningful KPIs, build management dashboards, implement Power BI reporting, integrate systems, and create a scalable foundation for analytics and future AI initiatives.
Data exists everywhere. Reliable insight often does not.
Businesses generate information across ERP, CRM, accounting systems, custom applications, spreadsheets, machines, portals, and departmental databases. The challenge is not collecting more data.
It is creating a trusted, understandable view of what is happening and what needs attention - one that people believe enough to act on.
- Management receives reports after decisions have already been delayed
- Different departments calculate the same KPI differently
- Teams spend excessive time compiling and reconciling spreadsheets
- Reports show totals but not exceptions, ageing, or trends
- Operational systems are disconnected and hard to compare
- Users cannot trace a dashboard number back to its source data
- Access to sensitive information is not controlled consistently
- Raw system data is not shaped for reporting, so every report re-does the same cleanup
- Data quality issues reduce confidence in every report
Why a better-looking dashboard does not fix it
A visually impressive dashboard cannot compensate for unclear definitions, inconsistent data, or disconnected ownership. Before anything is built, five things have to be settled:
- Which business decision the report exists to support
- What each KPI actually means, and how it is calculated
- Where the information comes from, and who owns it
- How often it updates, and what delay is acceptable
- What action is expected when a value moves
A dashboard is the final layer, not the starting point
We start from the decisions the report has to support, then work backwards: the meaning of each KPI, the source of the information, the update frequency, and the action expected when a value changes.
From there we design the data, integration, semantic, reporting, access, and governance layers needed to produce insight people will actually rely on - rather than another report nobody opens.
That nearly always includes an ETL layer. Operational systems are built to run transactions, not to answer management questions, so the data has to be extracted, cleaned, reshaped, and reconciled before any dashboard on top of it can be trusted.
Move from manually prepared reports to trusted decision support: clear definitions, connected data, understandable dashboards, and accountable actions.
Solutions we build
Most engagements combine more than one of these. Open any to see what it includes.
The most important part of any BI implementation is agreeing what each measure means. We facilitate that discussion with business owners before a single visual is built - because a disputed number is worse than no number.
- The business objective the KPI supports
- Definition and calculation logic
- Source systems and named data owner
- Frequency and acceptable delay
- Target, threshold, and exception logic
- Required detail and drill-through
- Responsible user and follow-up action
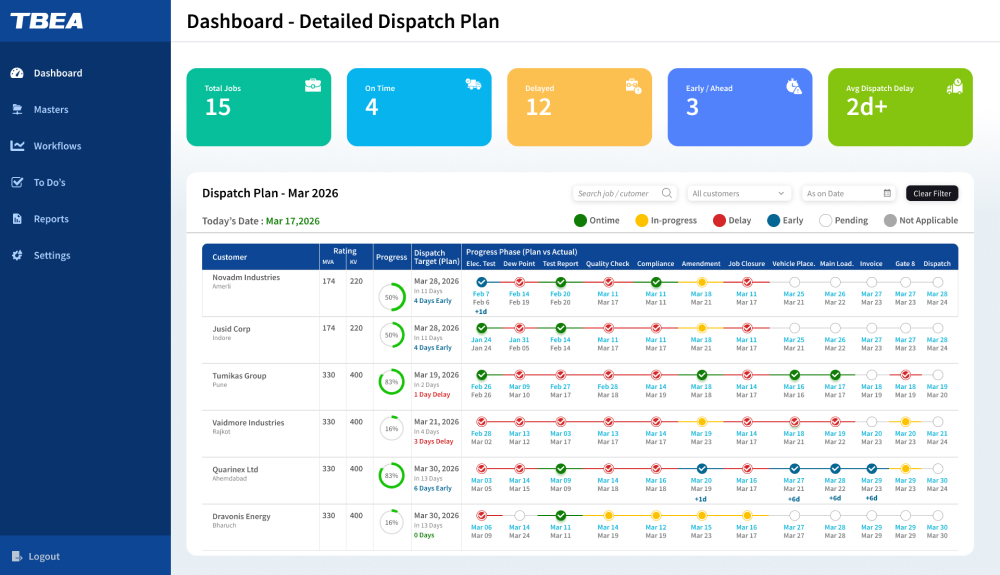
A concise view of performance, trends, exceptions, and priorities across business functions - built so leadership can see what needs attention without asking anyone to prepare it.
- Executive KPI scorecards
- Operational and commercial summaries
- Trend and variance analysis
- Exception and ageing views
- Drill-through to supporting detail
- Scheduled and role-based reporting
Power BI solutions for management, operations, sales, finance, quality, and service - covering data modelling, measures, visualisation, access, refresh, deployment, and getting people to actually use them.
- Interactive dashboards and reports
- Reusable data models and KPI definitions
- Role-based views and row-level security
- Drill-down and drill-through analysis
- Scheduled refresh and distribution
- Embedded reporting in applications or portals
Dashboards that help teams manage daily performance rather than review it at month-end, when it is too late to change the outcome.
- Turnaround time and ageing
- Approval and workflow bottlenecks
- Production-support and service visibility
- Quality observations and closure
- Quotation and sales activity
- Vendor, dealer, and customer interactions
We connect approved sources using APIs, database integrations, connectors, files, scheduled processes, or suitable integration services - and then do the part most people underestimate. Operational data is almost never shaped for reporting, so an ETL or ELT layer is required on most implementations: joining across systems, cleansing, deduplicating, standardising codes and master data, and historising values so a KPI means the same thing this month as last.
- ETL and ELT pipeline design and development
- Source profiling, cleansing, and deduplication
- Mapping, transformation, and business rules
- Incremental loads, scheduling, and orchestration
- Error handling, retries, and refresh monitoring
- Reconciliation back to the source system
- ERP, CRM, finance, and custom application sources
- Excel, SharePoint, Microsoft 365, and machine or sensor data
Legacy reporting often depends on old databases, manual extracts, or duplicated structures. We assess, cleanse, transform, migrate, and reorganise data so reporting and future applications have something solid underneath.
- Source inventory and data profiling
- Mapping, transformation, and validation rules
- Historical data migration
- Master-data alignment
- Reconciliation and sign-off
- Controlled cutover and post-migration support
For larger or evolving requirements we design Microsoft-aligned data architectures using Power BI, Azure data services, and Microsoft Fabric where appropriate. The platform should reflect your data volume, governance, skills, budget, and future AI goals - not a technology trend.
- Data architecture and platform selection
- Lakehouse and warehouse design
- Semantic models and shared definitions
- Refresh, orchestration, and monitoring
- Cost and licensing considerations
- A foundation ready for AI use cases
What each function actually needs to see
Select a department to see the reporting we are most often asked to build there. Most programmes start with one and expand.
- Enterprise scorecards
- Revenue and margin trends
- Operational exceptions
- Project and service performance
- Strategic progress indicators
Nobody adopts a report they do not believe
Users will not adopt a reporting platform unless they trust the information in it. Governance should be proportionate to the scale and sensitivity of the implementation - not a bureaucracy bolted onto a departmental dashboard.
- Clear data ownership and approved sources
- Consistent KPI definitions across departments
- Validation and reconciliation controls
- Role-based report and data access
- Refresh monitoring and failure handling
- Auditability of transformations and changes
- Documentation of models, measures, and dependencies
- Controlled release and change management
How the analytics stack fits together
Five layers, with the business user at the top and the source systems at the bottom. The shape is confirmed during discovery.
8 steps, start to adoption
Identify
The decisions, users, and business questions the solution has to support.
Inventory
Existing reports, KPIs, systems, spreadsheets, and where the current pain is.
Define
KPI logic, data ownership, refresh requirements, and access rules.
Profile
Source data quality and integration feasibility, before promising anything.
Prototype
A dashboard built with representative data so people can react to something real.
Build
ETL pipelines, data models, integrations, reports, and governance controls.
Validate
Calculations reconciled with business owners until the numbers are agreed.
Adopt
Deploy, train, monitor usage, and enhance on feedback.
What changes once it is live
- Faster and more confident decision-making
- Reduced manual report preparation
- Consistent KPI definitions across departments
- Improved visibility into exceptions and bottlenecks
- Better management accountability
- A trusted data foundation for applications and AI
- Reporting that scales to new locations, departments, or business units
- Business-first KPI and reporting design, not visualisation for its own sake
- Experience integrating dashboards with custom applications and workflows
- Power BI, Microsoft-aligned, and modern application capability
- Understanding of industrial and process-driven use cases
- We address data, application, integration, and experience layers together
- Ongoing support, enhancement, and reporting governance
Before you commit to anything
If your question is not here, ask it on a call - we would rather answer it before a proposal than after.
Yes, subject to available APIs, database access, connectors, security policies, and data model. Some integrations are direct; others need a staging or integration layer.
Direct connections work for simple, single-source reporting. In practice most implementations need an ETL or ELT layer, because operational systems are designed to run transactions rather than answer management questions. The data usually has to be joined across systems, cleansed, deduplicated, standardised, and historised before a KPI can be calculated consistently. Building that logic inside individual reports instead hides it, duplicates it, and makes results impossible to reconcile.
Power BI is a major capability but not the only answer. We select the reporting approach based on the business requirement, existing platform, embedding needs, user experience, and architecture.
Refresh frequency depends on the source system, integration method, platform, data volume, and business need. Not every KPI justifies real-time updates, and pretending otherwise adds cost without value.
Yes, provided the required sources, mapping rules, access, and common definitions are available. Agreeing common definitions is usually the harder half.
We define calculation logic, reconcile reports against approved sources, test transformations, document assumptions, and obtain business-owner validation before go-live.
Yes. Role-based access and row-level security can be designed where the selected platform supports it.
Yes, depending on licensing, architecture, authentication, and intended audience.
Fabric is a Microsoft data and analytics platform. Whether it suits you depends on scale, data sources, governance, existing investment, skills, and future analytics requirements. Many organisations do not need it yet.
Yes. We review the logic and data sources first, then decide which spreadsheets should be replaced, standardised, retained, or integrated - some are worth keeping.
Yes. Support can include refresh monitoring, issue resolution, source changes, new KPIs, report enhancement, performance improvement, and user administration.
Case studies built on this capability

Need a clearer view of what is happening across your business?
Start with a reporting and data discovery session. We will review the decisions you need to support, the systems that hold the information, and the most practical path toward dashboards people trust.